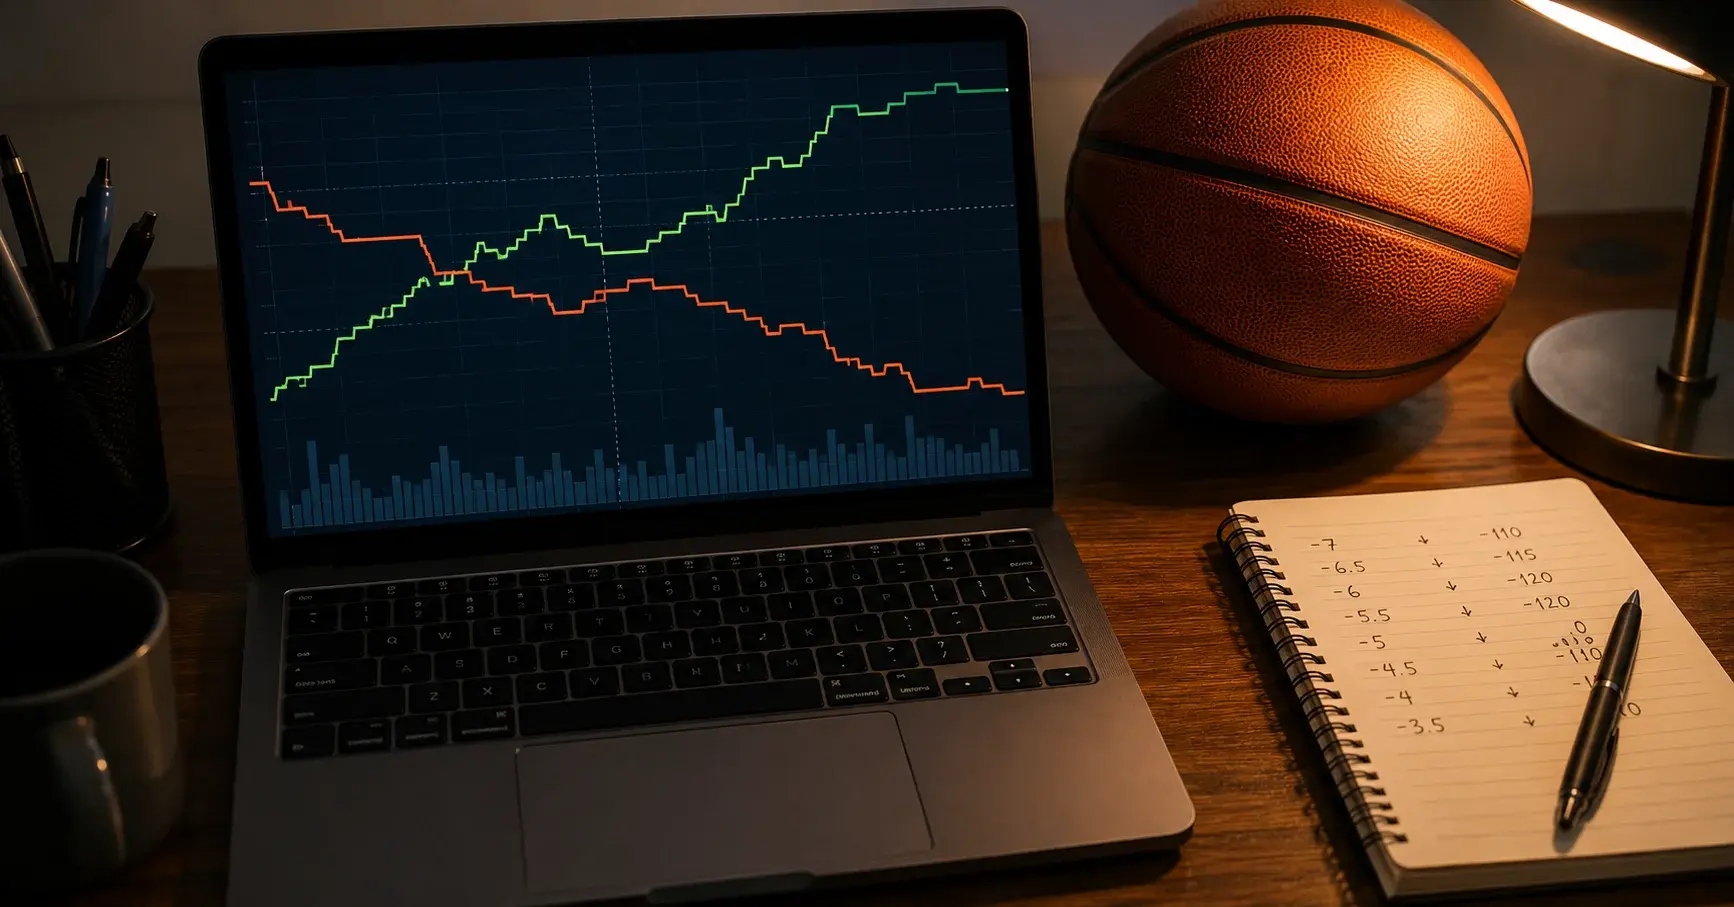
I once placed a bet on a spread that looked irresistible — a top-four team favoured by only 3.5 points against a struggling opponent. Twenty minutes later, the spread had moved to 1.5. I checked the injury report and discovered the team’s best player had been upgraded from “probable” to “out” with a calf strain. My 3.5-point line was now sitting on the wrong side of a two-point swing, and I had no exit. That experience hammered home a rule I now follow religiously: never bet an NBA spread before checking the injury report, and never assume that “probable” means “playing.”
Injury information drives some of the sharpest and fastest line movements in the NBA market. The 2025 gambling arrests involving Terry Rozier and Chauncey Billups exposed how insider knowledge of injury statuses can be exploited for illegal advantage — a stark reminder that injury data is not just relevant to betting analysis, it is central to market integrity. For UK punters operating within UKGC-regulated markets, the lesson is practical: the faster and more accurately you incorporate injury data into your analysis, the closer you get to the informed edge that separates profitable bettors from casual ones.
Pricing Adjustments Due to NBA Star Absences
Last season I tracked every game in which a top-fifteen player (by win shares) missed a start, and the pattern was consistent enough to build a system around. When a genuine star — a player whose on-court/off-court net rating differential exceeds +5.0 — is confirmed out, the spread moves by an average of 2.5 to 4 points. That range depends on the player’s specific impact, the quality of his replacement, and whether the opponent adjusts its game plan to exploit the absence.
The market typically processes a star absence in two phases. The first phase happens within minutes of the official announcement: the spread shifts sharply as algorithmic models reprice the game. The second phase unfolds over the following one to three hours as human bettors — both sharp and public — adjust their positions. The first phase captures most of the move, but the second phase occasionally overshoots, creating a brief window where the line has moved too far. I have found that backing the team with the absent star at the inflated spread — after the overcorrection — produces a positive ATS return in a meaningful sample of games.
Totals react differently to injuries than spreads do. When an elite offensive player sits out, the total drops — but not by as much as you might expect. The replacement player may not match the star’s scoring output, but the opposing team’s defensive effort often relaxes without the star to focus on, and the overall pace can increase as the shorthanded team pushes tempo to compensate. The net effect on the total is usually smaller than the net effect on the spread, which creates an opportunity: the public assumes the total should drop significantly when a scorer is out, but the actual data suggests a more modest decline.
NBA Injury Report Schedule and Betting Windows
Timing is everything in injury betting, and the NBA’s injury report schedule creates specific windows that disciplined punters can exploit. The league mandates that all teams submit injury reports by 17:00 Eastern Time on game days — that is 22:00 BST during the regular season. For UK punters, this means the most actionable injury information arrives late in the evening, roughly one to five hours before tip-off depending on the game’s start time.
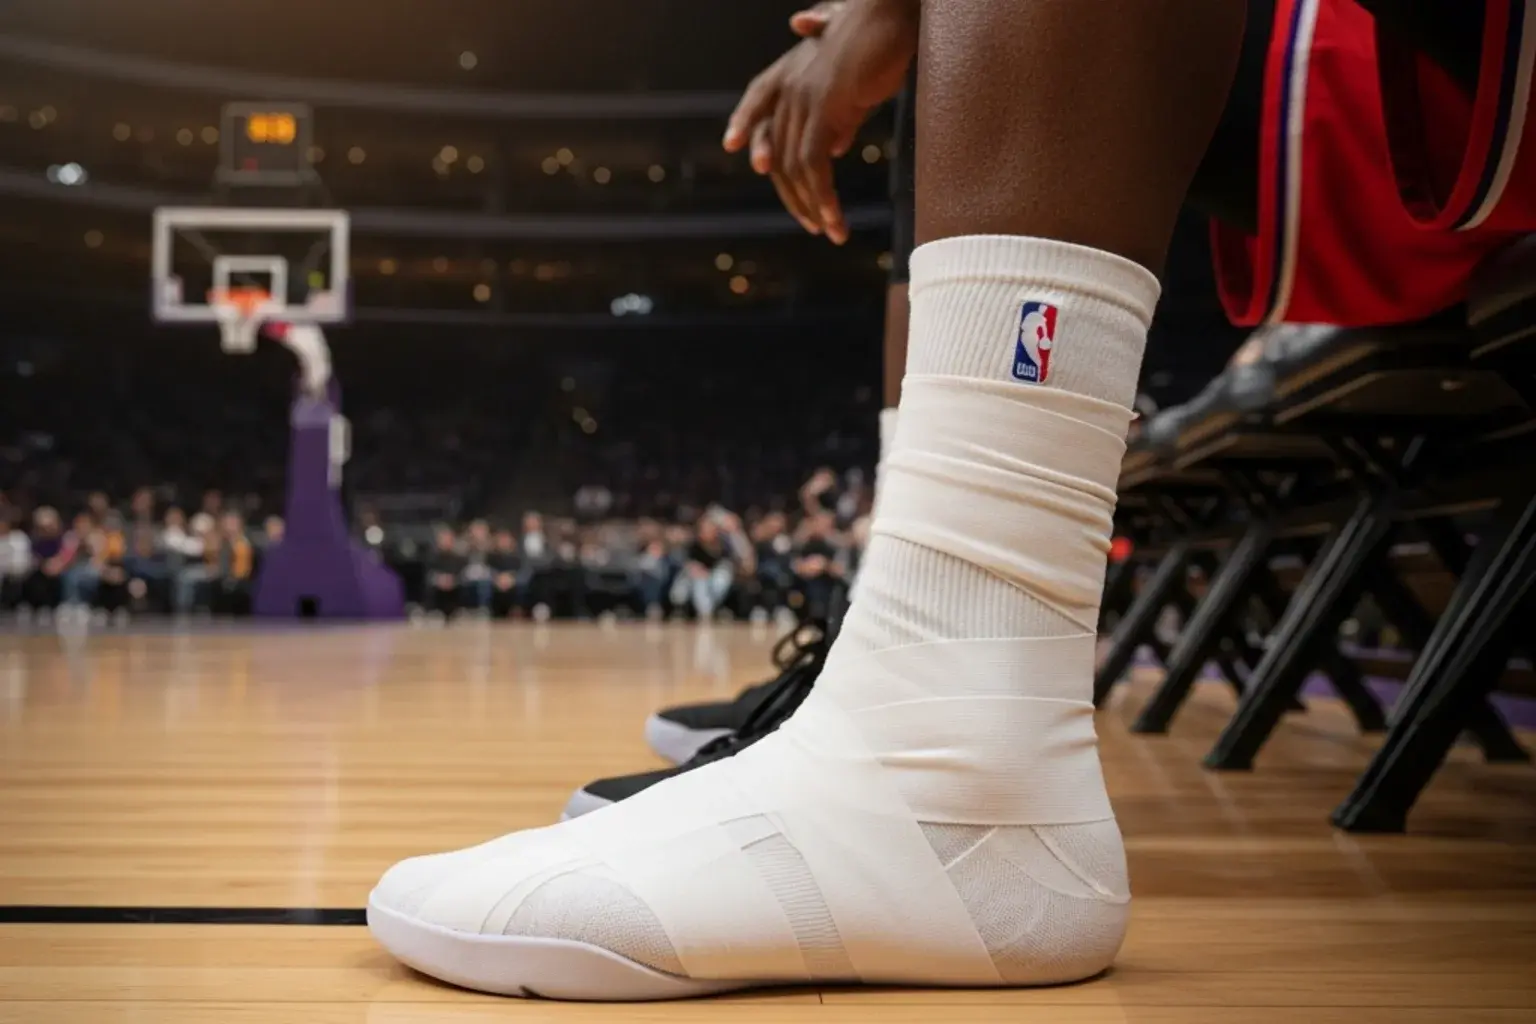
There are three injury report categories that matter for betting: “out” (the player will not play), “doubtful” (the player is unlikely to play), and “questionable” (the player’s status is genuinely uncertain). “Probable” was eliminated from the NBA’s official reports several seasons ago, though some bookmakers still use the term informally. The key insight for bettors is that “questionable” is the status that creates the most market inefficiency. When a star player is listed as questionable, the spread typically sits at a midpoint between the “star plays” and “star sits” lines. If you have reason to believe the player will or will not play — based on beat reporter updates, practice footage, or historical patterns for that specific player’s injury type — you can bet into a line that has not yet fully adjusted.
Live betting amplifies the injury dynamic further. In-play stakes account for 62.35% of online sportsbook revenue globally, and the NBA’s stop-and-start format means that in-game injuries create immediate repricing opportunities. A player rolling an ankle in the second quarter triggers a live spread adjustment within seconds — but the algorithm’s initial adjustment is based on generic injury models, not the specific player’s historical recovery patterns or the team’s depth at that position. Punters who know the roster inside and out can identify moments when the live line overreacts to an in-game injury.
Estimating Replacement Value When a Star Sits Out
The most common mistake I see in injury analysis is treating all star absences equally. A team losing its best player to injury is not always worse off by the same amount, because replacement value varies enormously depending on roster construction. A team with a deep bench and a competent backup at the star’s position might lose only 60% of the expected spread impact. A team with no viable replacement might lose more than the initial line move suggests.
I use a simple framework to estimate replacement value. First, I check the backup player’s on-court/off-court rating from the current season. If the backup has been on the floor for at least 200 minutes, his efficiency data is reliable enough to project. Second, I look at games earlier in the season where the star missed time — how did the team perform, and what was the backup’s statistical output? Third, I consider the matchup: some backups are better suited to certain opponents. A backup centre who is a strong rim protector may perform well against a team that relies on interior scoring, even if his overall numbers are unimpressive.
For , star absences create a cascade of secondary effects that are often mispriced. When a team’s primary scorer is out, the remaining players typically see increased usage rates. The second option might go from 18 shots per game to 23. The point guard might see his assist numbers drop because the absent star was his primary pick-and-roll partner. These secondary effects are where the most consistent prop edges exist around injury news — not on the spread itself, which the market prices efficiently, but on the individual props of the players who remain on the floor.