I spent most of my first NBA betting season ignoring trends entirely. My philosophy was pure: evaluate each game on its merits, ignore the noise of historical patterns, and trust the numbers in front of you. That approach worked until January, when I noticed something I could not explain through game-level analysis alone — underdogs in certain scheduling spots were covering at rates far above what my models predicted. I was leaving money on the table by refusing to look at the broader picture. Trends do not replace analysis. They frame it.
The sheer volume of money flowing through NBA betting markets makes trend data impossible to dismiss. Roughly 22% of American adults placed a sports bet in the past year, and the NBA’s daily schedule means that public money pours into these markets on a near-nightly basis from October through June. That volume creates predictable patterns — biases in how the public bets, seasonal rhythms in how teams perform against the spread, and contrarian signals that emerge when sharp money diverges from the crowd. Understanding these patterns gives UK punters an additional layer of context that pure matchup analysis alone cannot provide.
Identifying Seasonal Betting Patterns from Public Bias
Every October, I watch the same cycle repeat. A high-profile team wins its first five games, the public piles onto their spread, and the bookmaker adjusts the line upward to balance the action. By mid-November, that team’s ATS record has deteriorated — not because the team got worse, but because the line inflated beyond the team’s actual margin of superiority. Public bias is the engine that drives seasonal patterns in the NBA, and understanding how that engine works is the first step toward exploiting it.
The mechanism is straightforward. Casual bettors gravitate toward teams they recognise, teams with star players, and teams on winning streaks. This concentration of public money on popular sides forces bookmakers to shade the line toward those teams, creating value on the less popular side. The pattern is most pronounced in the first two months of the season, when the public is making decisions based on reputation rather than current-season data. A team that reached the conference finals last year carries an aura into October that inflates its spread regardless of off-season roster changes.
Where this gets interesting for UK punters is the timing asymmetry. NBA games tip off between 23:00 and 03:30 BST during the regular season. The majority of public money is placed by American bettors during their afternoon and early evening — hours before UK punters are typically active. By the time you sit down to evaluate the late-night slate, the lines have already absorbed the bulk of public bias. This means UK punters are often betting into lines that have already been shaded by public money, which can work to your advantage if you are taking the .
I track public bias monthly across three categories: team popularity (how often a team appears on the public side of the percentage split), spread inflation (the average difference between a team’s opening and closing line), and ATS performance relative to public backing. Teams that consistently attract more than 65% of public bets tend to underperform ATS over the course of a season. The pattern is not dramatic — we are talking about a 2-4% edge, not a goldmine — but compounded across 82 games per team and a full season of betting, that edge is real and measurable.
Seasonal ATS and Totals Patterns in the NBA
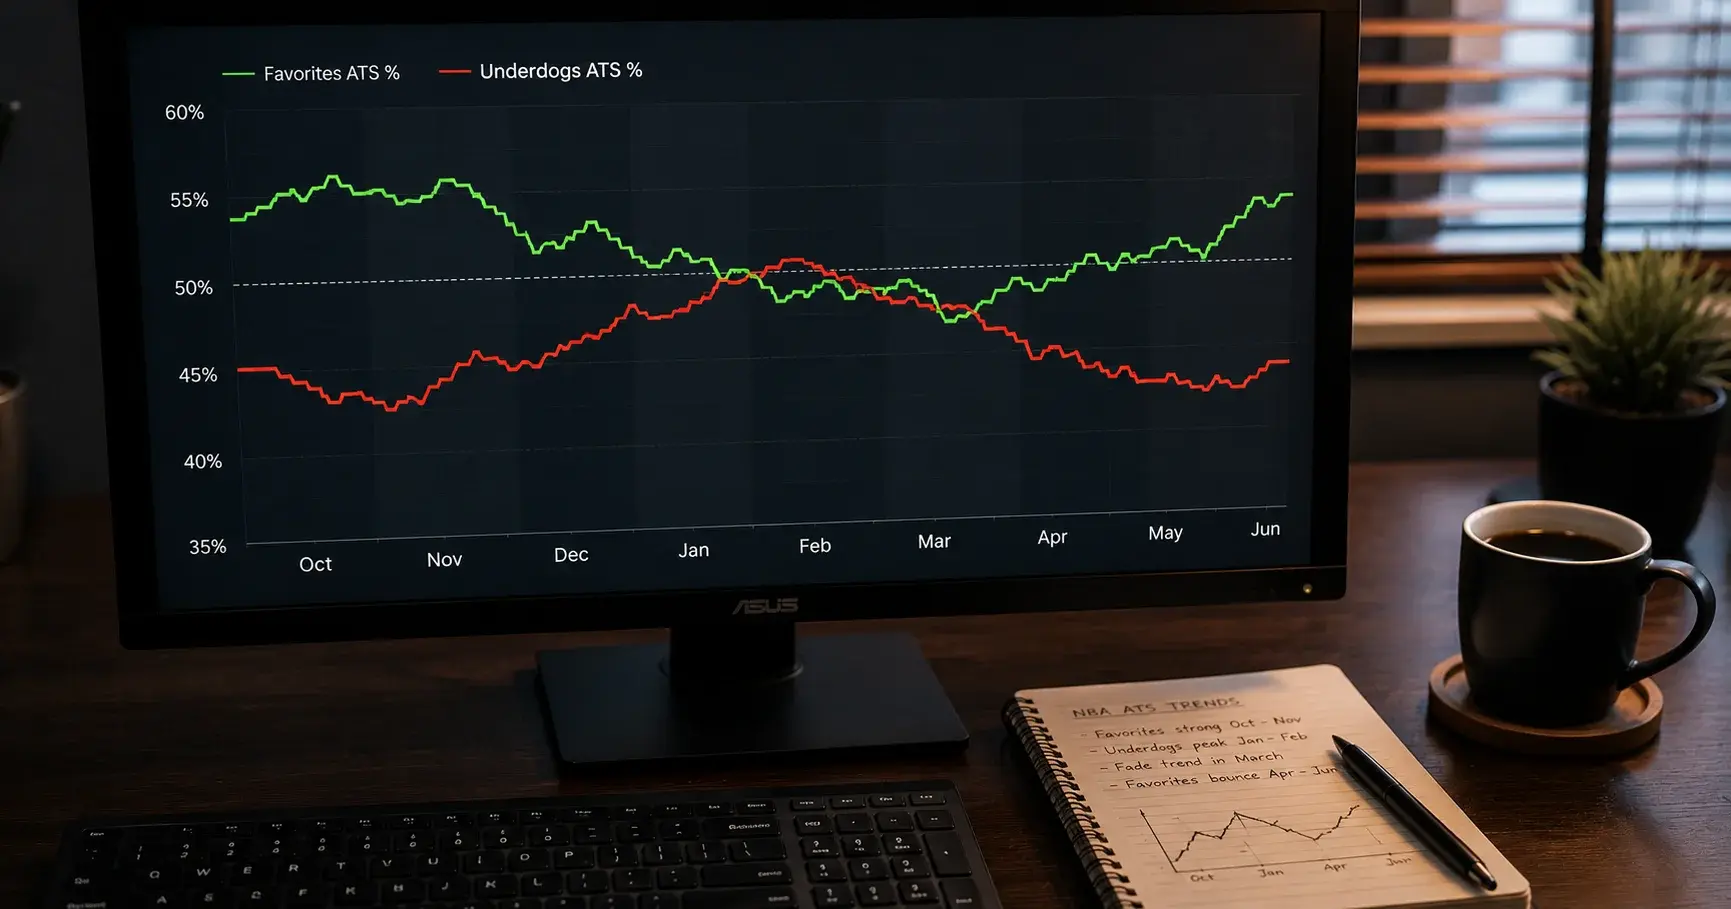
I keep a colour-coded spreadsheet that tracks ATS performance by month, and the patterns are remarkably consistent year over year. October and early November produce the most inefficient lines because bookmakers are pricing teams based on incomplete data — pre-season projections, last season’s performance, and summer roster moves that have not yet been tested in live action. This is the window where early-season underdogs cover at the highest rates, particularly when facing teams that the public has anointed as contenders before the season has proved them right.
The global sports betting market has swelled to $112.26 billion, and a disproportionate share of NBA handle concentrates around marquee dates: the Christmas Day slate, the Martin Luther King Jr. Day games, and the final week of the regular season when playoff seeding is decided. These high-profile dates attract a surge of casual bettors, which amplifies public bias and creates value on the less popular side. I have tracked Christmas Day NBA betting for six consecutive seasons, and the contrarian side has covered in 58% of games across that sample — small sample, but consistent.
Totals patterns follow a different rhythm. Early-season games tend to go over at higher rates because teams have not yet established their defensive identities and pace is typically elevated. By January, as teams settle into their rotations and defensive schemes tighten, the under begins to hit more consistently. The all-star break creates a brief spike in overs — the games immediately before the break often feature lower defensive intensity as players coast toward the rest period. Post-all-star, unders dominate again until the final two weeks of the season, when teams resting starters for the playoffs push totals back down.
One nuance that most trend analyses miss: the NBA trade deadline in February creates a two-week window of extreme line instability. Teams that make significant acquisitions see their lines adjust rapidly, but the market often overreacts to blockbuster trades and underreacts to role-player moves that improve bench depth. I focus my February betting on teams that added depth without headlines — the kind of transactions that do not shift public perception but do shift on-court performance.
Contrarian Signals That Historically Predict Value
The word “contrarian” gets thrown around recklessly in betting circles. Being contrarian does not mean blindly betting against the public on every game — that approach produces roughly break-even results after the vig. Effective contrarian betting means identifying the specific conditions under which public bias creates exploitable value, and then acting only when those conditions are present.
The strongest contrarian signal I have found in NBA markets is the combination of heavy public backing on one side (above 70% of tickets) and a line that moves against the public money. If 75% of bets are landing on Team A at -5.5, but the line drops to -5 or even -4.5, that is a clear indication that sharp money — the large wagers placed by professional bettors — is on Team B. The bookmaker is responding to the dollars, not the ticket count. This reverse line movement has been one of the most reliable predictive signals in my nine years of NBA betting.
Another contrarian signal worth tracking is the “overreaction fade.” When a team suffers a blowout loss — losing by 20 or more points — the public tends to overreact in the next game. The losing team’s spread widens beyond what the underlying talent gap justifies, because casual bettors anchor on the most recent result. Fading that overreaction by backing the blowout loser in their next game has produced a positive ATS record in every full season I have tracked.
Travel and fatigue contrarian signals overlap with schedule analysis but deserve mention in this context. When a favoured team is playing the second night of a back-to-back on the road, public bettors still back that team at roughly the same rates as any other game. The line adjusts somewhat for the schedule disadvantage, but the public’s reluctance to bet against a “good team” keeps the spread from fully reflecting the fatigue discount. Taking the home underdog in these spots — especially when the favourite has also travelled across time zones — is one of the most straightforward contrarian angles in NBA betting.