I placed my first NBA totals bet on a sleepy Wednesday night in January — two mid-table teams nobody was talking about. The spread was a coin flip, but the total? The total told a story nobody in my local group chat had bothered to read. One side ranked bottom five in pace, the other played as if the shot clock was a suggestion they politely ignored. The under hit by twelve points, and I have been hooked on totals markets ever since.
Totals — the over/under — ask a fundamentally different question than spread or moneyline bets. You are not picking a winner. You are predicting the rhythm of the game itself: tempo, defensive intensity, shooting efficiency, even referee tendencies. That distinction matters because totals respond to variables that many punters overlook entirely. Live betting now accounts for 62.35% of online sportsbook revenue, and totals are among the most actively traded in-play markets in the NBA. When a team goes on a 14-0 run, the live total recalibrates in seconds — understanding why it moves that way gives you an edge before the market catches up.
This guide breaks down the pace metrics, defensive matchup factors and historical patterns that separate sharp totals bettors from casual over backers. Everything here is built for UK punters using decimal odds at UKGC-licensed bookmakers, but the analytical framework travels wherever basketball is played.
How Pace Drives NBA Totals
Last season I spent an evening cross-referencing team pace rankings with closing totals from the previous week. The correlation was so clean it felt like cheating — until I realised that bookmakers already factor pace into their opening numbers. The real value does not come from knowing that fast teams produce high totals. It comes from knowing when pace data misleads the market.
Pace, in NBA analytics, measures the number of possessions a team uses per 48 minutes. A team averaging 102 possessions per game will produce a different scoring environment from a team averaging 96. When two high-pace teams meet, the combined possession count inflates the expected total. When two slow teams grind it out, the opposite happens. That much is obvious. The subtlety lies in context. A team’s season-average pace can mask significant variation depending on opponent, game state and rest. A squad might average 100 possessions across the full season but push to 105 against up-tempo opponents and drop to 94 when protecting a lead against a disciplined defensive side.
The practical step is to check pace-adjusted projections rather than raw season averages. Basketball Reference and NBA.com both publish pace data freely. I pull the last ten games for each team, filter by opponent defensive pace quartile and then compare that adjusted number against the bookmaker’s total. If the adjusted pace projection implies a total three or more points away from the posted line, that game gets a closer look.
Altitude creates its own pace anomaly. Games in Denver consistently produce higher totals than the league average, not because the Nuggets play faster, but because the thin air affects visiting teams’ shot selection and defensive rotation speed. Between 2018 and 2025, the average total in Denver home games ran roughly 2.5 points above the overall league average, and bookmakers frequently underpriced that gap during the first quarter of each season before their models adjusted.
One more thing worth tracking: garbage time. When a game gets out of hand early, benches clear and reserves play at a different tempo from starters. High-blowout games can push the final combined score well above what the competitive pace of the first three quarters suggested. If you are betting the over before tip-off, a potential blowout scenario actually helps — both teams’ reserves keep scoring without strategic incentive to slow down.
Defensive Matchup Variables That Move the Total
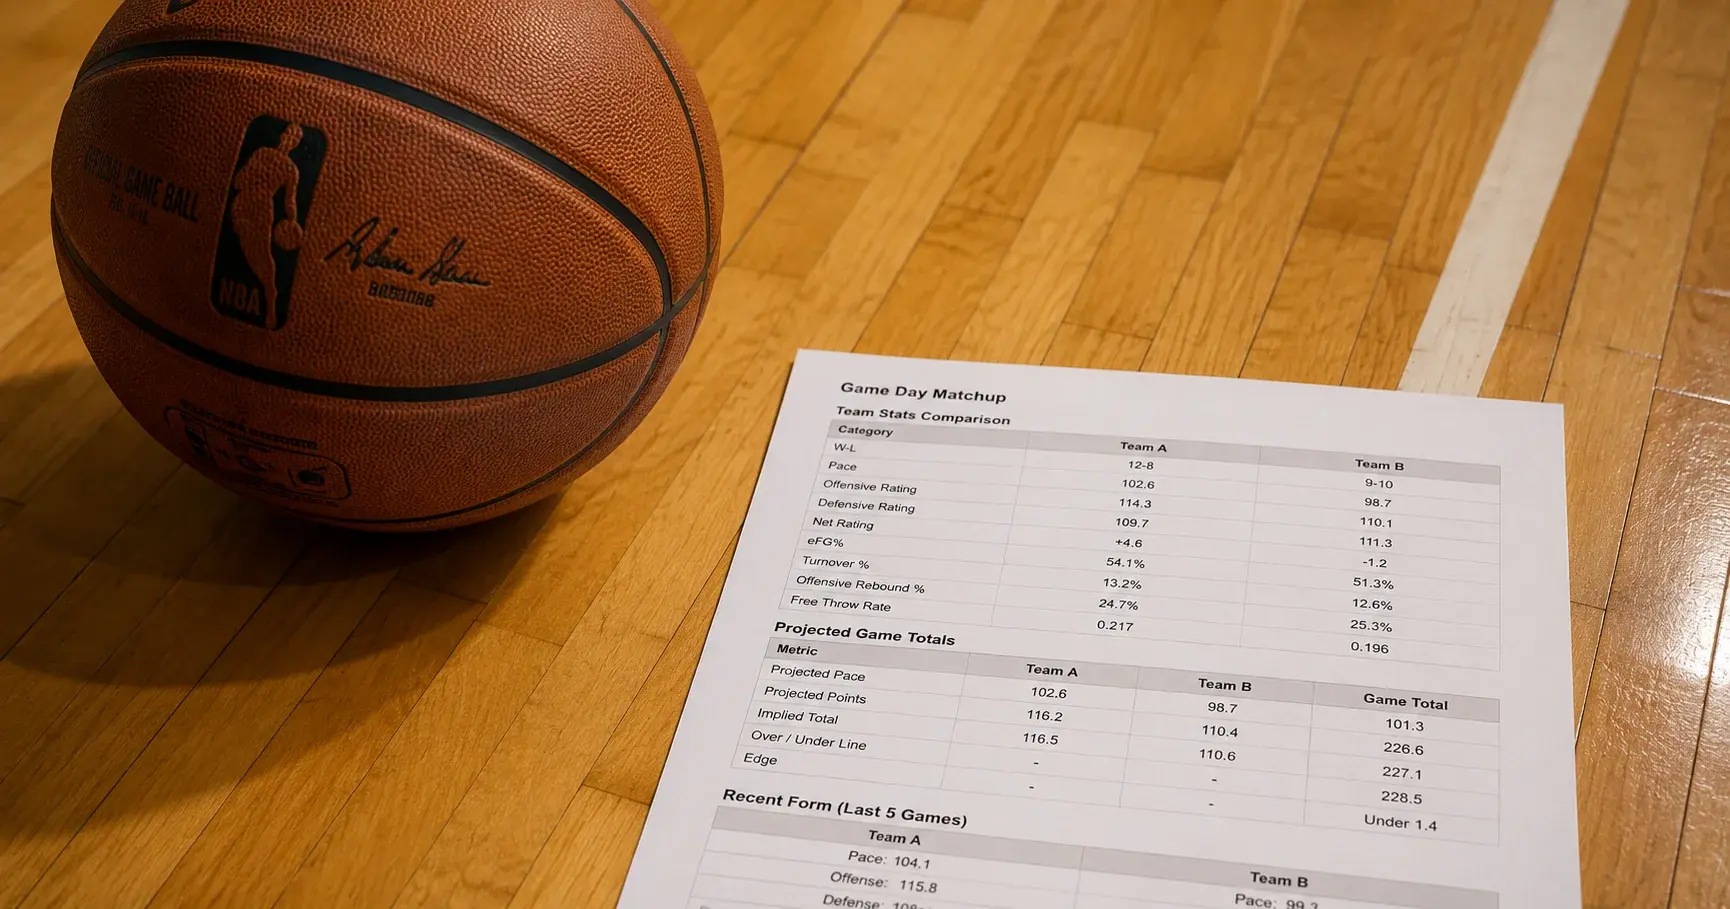
A few seasons back I got burned badly on a total I thought was a lock. Two top-ten offensive teams, pace suggested 225+, and I hammered the over at 228.5. The game finished 101-98. What I had ignored was that one team had just traded for a rim protector who altered every shot inside the paint. Defence, not offence, decided the outcome — and my bankroll took the hit.
Defensive rating — points allowed per 100 possessions — is the single most underrated variable in totals analysis. Casual punters fixate on how many points a team scores. Sharp totals bettors pay equal attention to how many points a team prevents. When a top-five defence faces a middle-of-the-road offence, the total almost always skews lower than the raw scoring averages imply, because the defensive pressure suppresses the opponent’s efficiency while also slowing the game through forced turnovers and long defensive possessions.
Three-point defence adds another dimension. Teams that allow high three-point attempt rates tend to give up scoring in bursts — a run of three consecutive threes can add nine points to a game total in under two minutes. Conversely, teams that force opponents into mid-range shots create a lower-variance scoring environment. When evaluating a matchup for the over/under, check where each team ranks in opponent three-point attempt rate and opponent three-point percentage. A mismatch there — a poor perimeter defence meeting a high-volume three-point offence — is one of the strongest over signals in the market.
Rebounding differentials also influence totals, though less directly. A team that dominates the offensive glass generates second-chance points, which extend possessions and push the total higher. A team that controls the defensive boards ends possessions quickly, keeping the total down. The net effect depends on which team controls the glass on a given night, and that often correlates with rest and travel — which brings us to the schedule angles that connect all of this together.
Historical Totals Trends Worth Tracking
Numbers do not lie, but they do require patience. I track totals results in a spreadsheet that now covers four full NBA seasons, and the patterns that have held up are not the ones most punters expect.
The first reliable trend is the rest-day under. When both teams enter a game on two or more days’ rest, defensive intensity tends to spike. Fresh legs mean faster rotations, more contests at the rim and fewer breakdowns in transition. Over the past three seasons, games where both teams had at least two rest days hit the under at a rate noticeably above the coin-flip baseline. The market prices rest into the spread, but it consistently underprices rest into the total — possibly because casual bettors associate “rested teams” with “energised offences” when the bigger impact lands on the defensive end.
Back-to-back games create the opposite dynamic, and here the upset-rate data adds context. NBA underdogs win roughly 35-40% of games outright, but the more relevant figure for totals bettors is that back-to-back road teams tend to see their defensive efficiency drop by 1.5 to 2.5 points per 100 possessions. That decline pushes the total higher, particularly in the third quarter when fatigue erodes help-defence rotations. If you spot a team on the second night of a back-to-back travelling to a high-altitude venue or a team with top-ten pace, the over becomes a data-supported play rather than a gut feeling.
Seasonal timing matters too. October and November games — the first six weeks of the regular season — produce higher-than-average totals because defensive schemes have not yet solidified. Teams are integrating new players, testing rotations and prioritising offensive rhythm. By January, most teams have settled into their defensive identity, and totals tighten. Then comes the All-Star break, after which the second half of the season often sees a bump in unders as teams with playoff ambitions tighten their rotations and prioritise defence. Tracking these seasonal shifts can highlight stretches where the market consistently misprices the total by two or three points.
One last pattern I have found useful: nationally televised games. ESPN and TNT matchups tend to feature higher-profile teams that , but the totals on these games also carry a slight upward bias because bookmakers anticipate public over money. When the sharp data suggests an under, nationally televised games occasionally offer an extra half-point of value on that under line because the public has pushed it higher.