
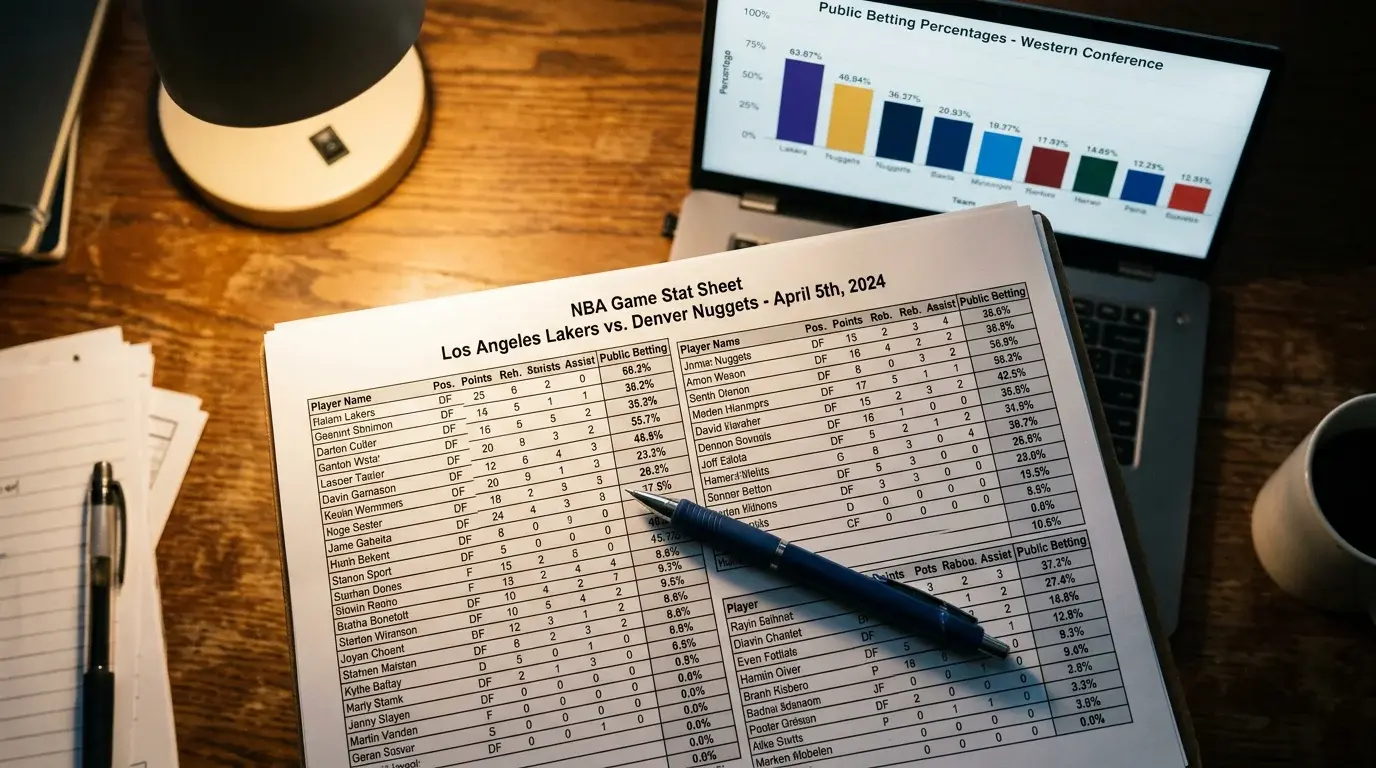
The first time I seriously studied public betting data, I was convinced I had found a cheat code. A heavily favoured home team was drawing 78% of tickets on the spread, yet the line was moving toward the underdog. Something did not add up — until I looked at the handle split. The ticket percentage told me what most bettors thought. The handle percentage told me where the real money was going. Those two numbers were telling completely different stories, and the handle was right. The underdog covered by six points. That night taught me that in NBA betting, counting bets and counting money are entirely different exercises.
About 22% of American adults placed a sports bet in the past 12 months, and a significant portion of that action flows into NBA markets. When that many people are betting, the sheer volume of tickets creates patterns that sharp bettors have learned to exploit. Public betting percentage data — which tracks how many individual bets and how much total money sits on each side of a line — has become one of the most valuable tools for identifying when the crowd is wrong and when the professionals are quietly loading up on the other side.
Contrasting Ticket Counts and Betting Handle Data
Ticket percentage measures the number of individual bets placed on each side of a line. Handle percentage measures the total money wagered on each side. The distinction matters because not all bets are the same size. A hundred casual bettors might each stake £10 on the Lakers to cover, creating 100 tickets and £1,000 in handle on one side. Meanwhile, three sharp bettors might stake £2,000 each on the opposing side, creating just three tickets but £6,000 in handle. The ticket split reads 97%-3% in favour of the Lakers. The handle split reads 14%-86% against them. Which number should you follow?
The handle, almost always. Roughly 54% of online sports bettors place wagers at least once or twice a week, and the majority of those frequent bettors are recreational players who bet small amounts on popular sides. Their individual tickets are noise in the aggregate — they represent sentiment, not information. The handle percentage, by contrast, is weighted toward the larger wagers that sharp bettors and syndicates place. When the ticket percentage and the handle percentage diverge significantly — say tickets are 75% on one side but the handle is only 55% on that same side — it means the large bettors are positioned against the public. That divergence is one of the strongest contrarian signals available in NBA betting.
I track this divergence across every NBA game I consider betting, and I have found that the signal is strongest when the gap between ticket percentage and handle percentage exceeds 15 points. Below that threshold, the divergence could simply reflect normal variation in bet sizes. Above 15 points, it consistently indicates informed money on the less popular side. The correlation is not perfect — no signal in sports betting is — but over a season-long sample, fading the side with heavy ticket support and light handle support has produced a positive return in my tracking.
For UK punters, the challenge is that most public betting data originates from US sportsbooks. The ticket and handle splits reported by American tracking services reflect American betting patterns, which do not perfectly mirror the UK market. However, because NBA is driven primarily by US-based action — the US market is vastly larger than the UK NBA betting market — the American public percentage data still influences the lines you see at UKGC-licensed bookmakers. When US sharp money moves a line, UK bookmakers adjust their odds in response, which means the US-derived public betting data is still relevant to your UK-based wager.
When Fading the NBA Public Consensus Works
Fading the public is not a blanket strategy. If you simply bet against the popular side in every NBA game, you will lose money, because the public is right more often than the contrarian community likes to admit. Popular teams are popular for a reason — they tend to be good, and good teams win more than they lose. The skill is in identifying the specific conditions where public sentiment has pushed the line past fair value, creating an exploitable gap between the number on the board and the true probability of the outcome.
The conditions I look for are specific. First, the game must feature a marquee team — one of the franchises that attracts casual betting attention regardless of the matchup. These teams generate disproportionate ticket volume because recreational bettors recognise the name and back them reflexively. Second, the ticket-handle divergence must exceed my 15-point threshold, confirming that sharp money is positioned against the public. Third, the line must have moved in the direction of the sharp money — meaning the number has shifted toward the unpopular side despite the heavy public ticket count on the other. When all three conditions align, fading the public has been profitable in my experience across multiple seasons.
The timing within the NBA season also matters. Public betting percentages are most exploitable during the early regular season — October through December — when casual bettors are still anchored to last year’s narratives. A team that won the championship the previous season attracts heavy public money even if their roster has turned over significantly. Similarly, a team that finished last attracts contrarian-for-the-sake-of-it money that is not grounded in any analytical edge. By February and March, the lines have adjusted to current-season performance, and the public’s anchoring bias has weakened. The value in fading the public is highest early and lowest late.
Playoff public betting presents a different pattern. The ticket concentration becomes even more extreme in the postseason — in some high-profile playoff games, over 80% of tickets land on the favourite — but the bookmakers are aware of this and shade their lines accordingly. The question is whether the shade is sufficient. In my tracking, the answer is usually yes for first-round and second-round games, where the bookmaker’s model is well-calibrated to public behaviour. But in the conference finals and Finals, the volume of recreational money exceeds what the bookmaker has historically seen, and the shade occasionally falls short, leaving residual value on the underdog side.
Where to Find Reliable NBA Public Betting Data
Access to public betting data has improved dramatically over the past five years, but the quality varies enormously depending on the source. The most reliable data comes from sportsbooks that voluntarily publish their own ticket and handle splits. Several major US operators now share this information directly, and aggregator sites compile it into dashboards that update throughout the day as betting volume accumulates. I cross-reference at least two sources before acting on a public percentage signal, because individual sportsbooks can have idiosyncratic customer bases that skew the data.
Tim Miller, Executive Director of Research and Policy at the UK Gambling Commission, has noted that even as participation in gambling increases, problem gambling rates have remained statistically stable — the percentage scoring four or more on the youth-adapted problem gambling screen moved from 1.5% to 1.2%, which he described as stable. That context matters for the public betting percentages discussion because it confirms that the growing pool of bettors is not fundamentally different in behaviour from the existing pool. More bettors means more tickets, but the distribution of sharp versus recreational money remains roughly constant, which keeps the ticket-handle divergence a viable signal.
For UK punters specifically, the practical workflow is to check the public percentage data from US sources during the early evening — when the US market opens and initial betting patterns emerge — and then place your bets at your UKGC-licensed bookmaker before the UK odds adjust. The window is short, typically 30 to 60 minutes after the US data becomes available, because UK bookmakers monitor the same data and adjust their lines accordingly. Setting up alerts or bookmarking the key aggregator dashboards saves time and ensures you are acting on the freshest data rather than stale numbers from earlier in the day.
A final note on data quality: free public betting percentage tools are useful for identifying the direction of the ticket-handle split, but they rarely provide the precise percentages that paid services offer. If you are serious about incorporating public betting data into your NBA analysis, a subscription to a reputable tracking service is a worthwhile investment. The cost is typically recovered within a few weeks if the data helps you avoid even one poorly-informed bet per week.